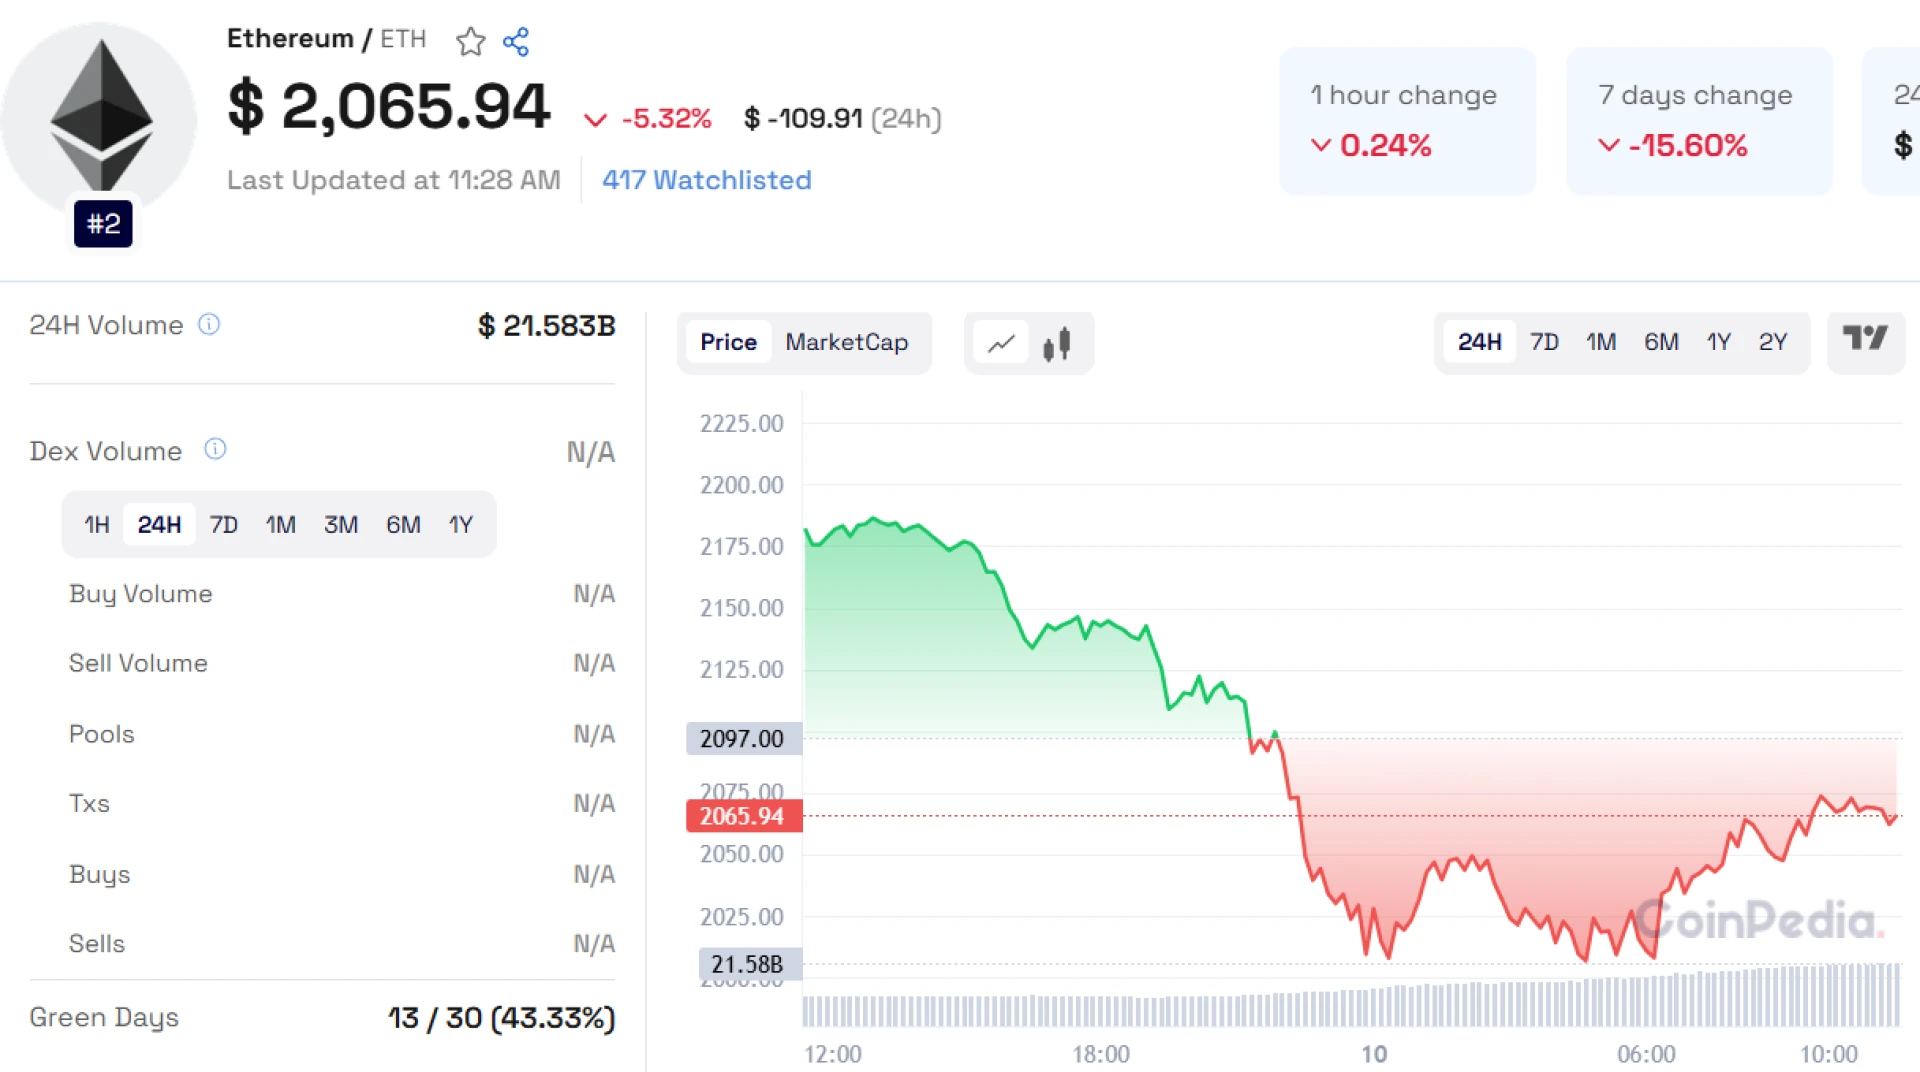
Ethereum (ETH) experienced a sharp decline last week, closing below the critical $2,125 support level and falling nearly 20%. On Monday, ETH traded around $2,051, with bearish momentum indicating a potential retest of the $1,905 support level.
Read Ethereum Price Prediction for 2025, 2026 - 2030
The daily chart's Relative Strength Index (RSI) showed a bearish reading of 35, with a bearish crossover on the MACD, suggesting the downtrend might continue. However, if ETH manages to recover above $2,125, it could test resistance at $2,359.
Historically, Ethereum has shown resilience during market downturns. For instance, during the 2022 bear market post-FTX collapse, ETH plummeted 80%. Yet, by March 9, 2025, ETH stabilized at a 53.11% drawdown, trading close to $2,300. Previous drawdowns of -70% in 2018 and -60% in 2021 were followed by strong recoveries.
The 2024 Dencun upgrade and ETF approvals bolstered ETH’s recovery, highlighting its long-term strength. Whale accumulation during price dips also boosted market confidence. Analysts predict a potential all-time high (ATH) breakout if ETH rallies to $3,000-$4,164.
Also Read: Fantom Price Prediction 2025
However, regulatory hurdles or market manipulation could trigger another -40% to -50% correction. The Binance ETH/USDT liquidation heatmap supports this view, with a volatility range between $2,050 and $2,250.
Ethereum's trading volume also paints a vivid picture. Between February 13 and March 6, volume surged from 50k to 450k, showing increased investor interest. High trading volumes often signal market strength, while a drop to 150k-200k could foreshadow a potential price decline.
In conclusion, Ethereum’s historical resilience, bolstered by market developments and investor interest, suggests potential for a bullish recovery. However, traders should watch regulatory developments and trading volume trends closely to gauge market direction.


Sign in to leave a comment.