Investing in mutual funds can be one of the smartest financial decisions you make, but only if you choose the right funds. With thousands of options available in the Indian market, how do you separate the winners from the underperformers? The answer lies in understanding how to properly evaluate fund performance, particularly their yearly returns.
Checking mutual fund yearly return data is essential before committing your hard-earned money. However, many investors make the mistake of looking at returns superficially without understanding what the numbers truly represent. This comprehensive guide will walk you through the process of evaluating mutual fund performance effectively, helping you make informed investment decisions.
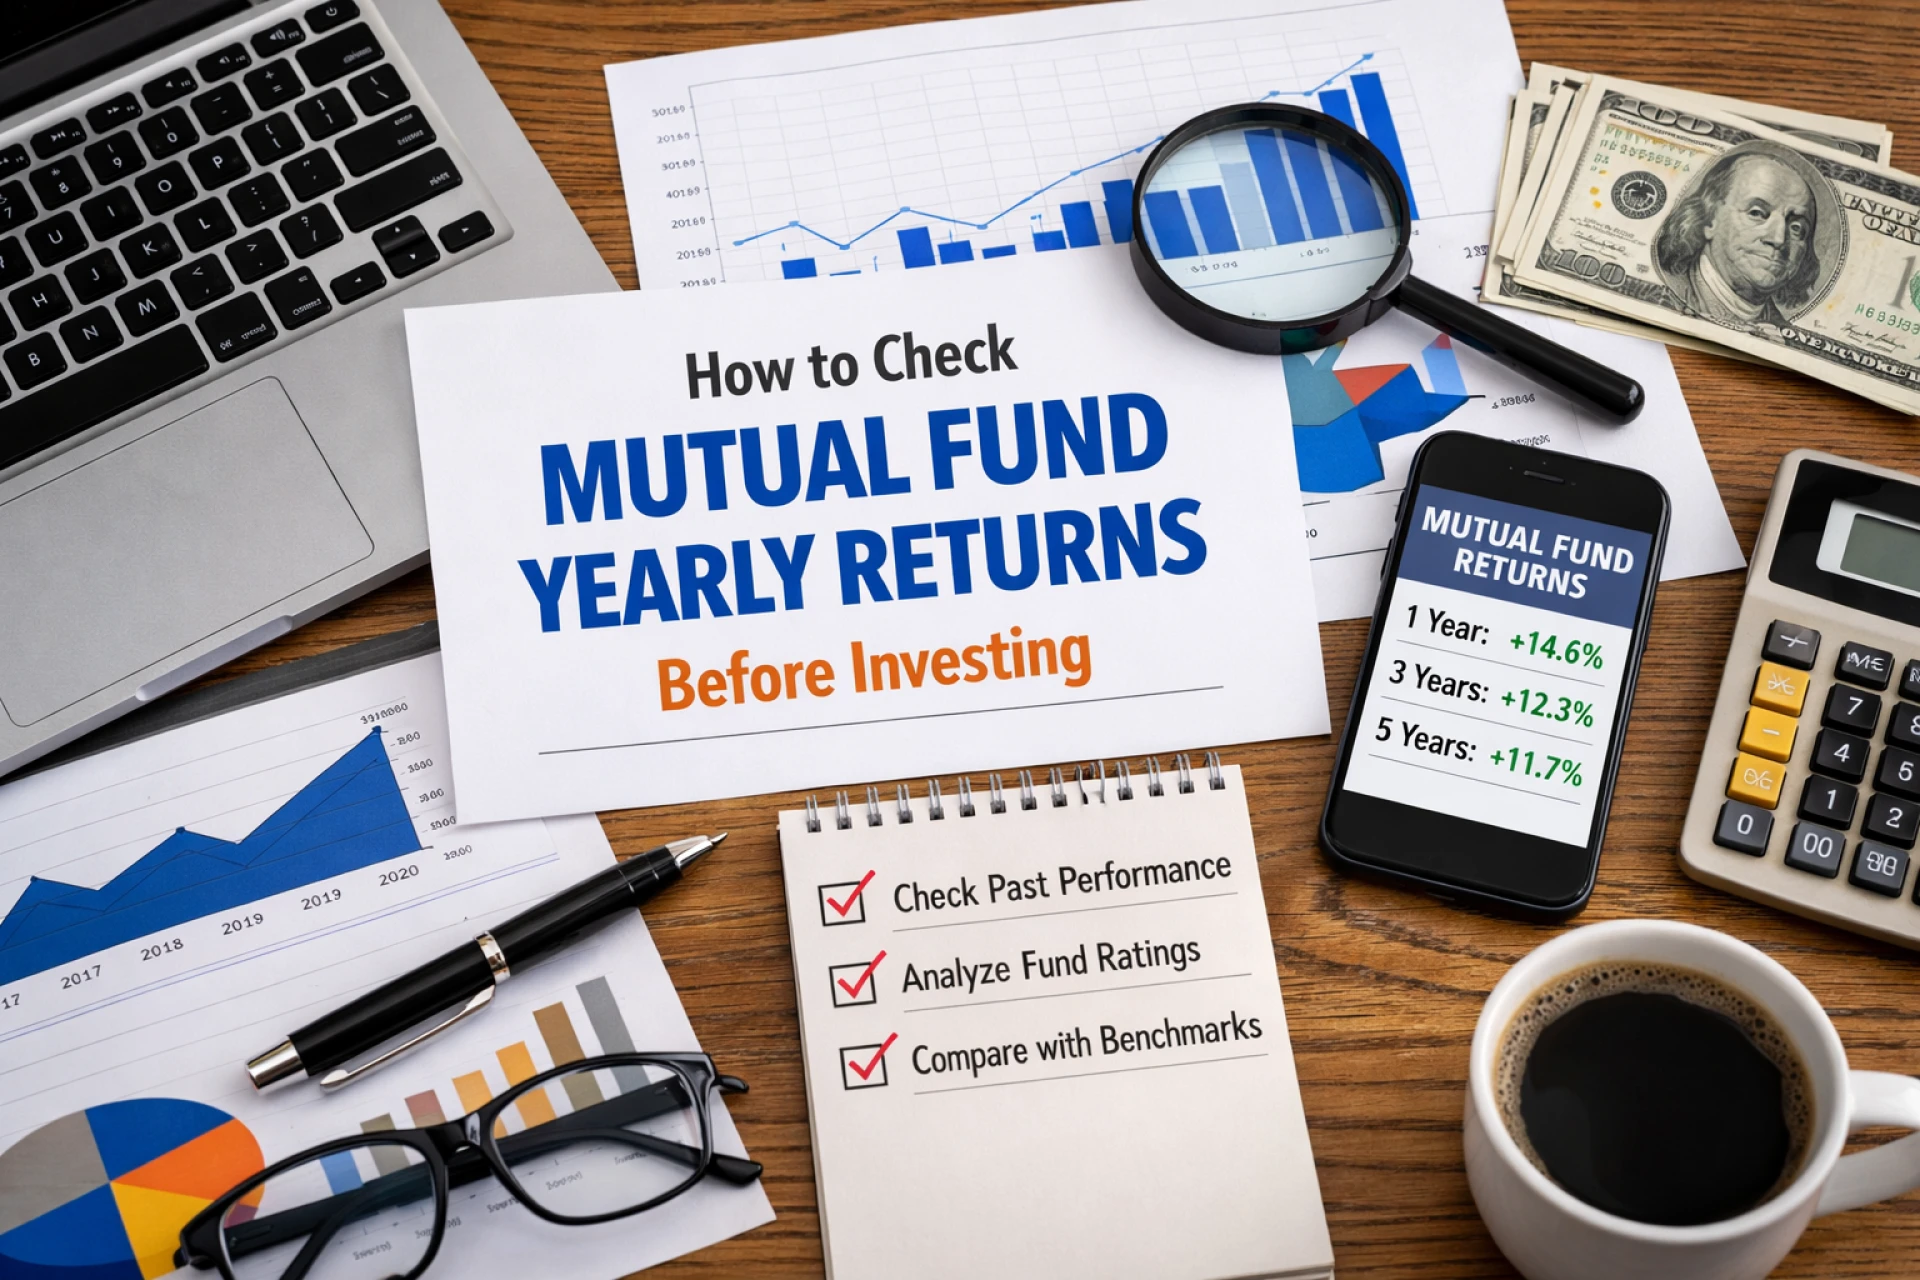
Why Yearly Returns Matter
Annual returns give you a snapshot of how a fund performed over a specific 12-month period. Unlike absolute returns that show total gains without considering time, yearly returns help you understand the fund's growth trajectory year by year. This breakdown reveals consistency, which is often more important than occasional spectacular performance.
Understanding average mutual fund growth per year helps set realistic expectations. Equity funds in India typically deliver 12% to 15% annual returns over the long term, while debt funds offer 6% to 9%. Knowing these benchmarks prevents you from chasing unrealistic promises or dismissing solid performers.
Where to Find Mutual Fund Yearly Returns
The most reliable source for performance data is the fund house's official website. Every Asset Management Company (AMC) publishes detailed fact sheets containing yearly returns, expense ratios, portfolio holdings, and other vital information. These documents are usually updated monthly and available for free download.
Financial portals and investment platforms also aggregate this data, making comparisons easier. Websites of regulatory bodies like SEBI and AMFI provide standardized performance information. Additionally, platforms like Quant Trade offer advanced analytics that go beyond basic returns, helping you analyze risk-adjusted performance and compare funds scientifically.
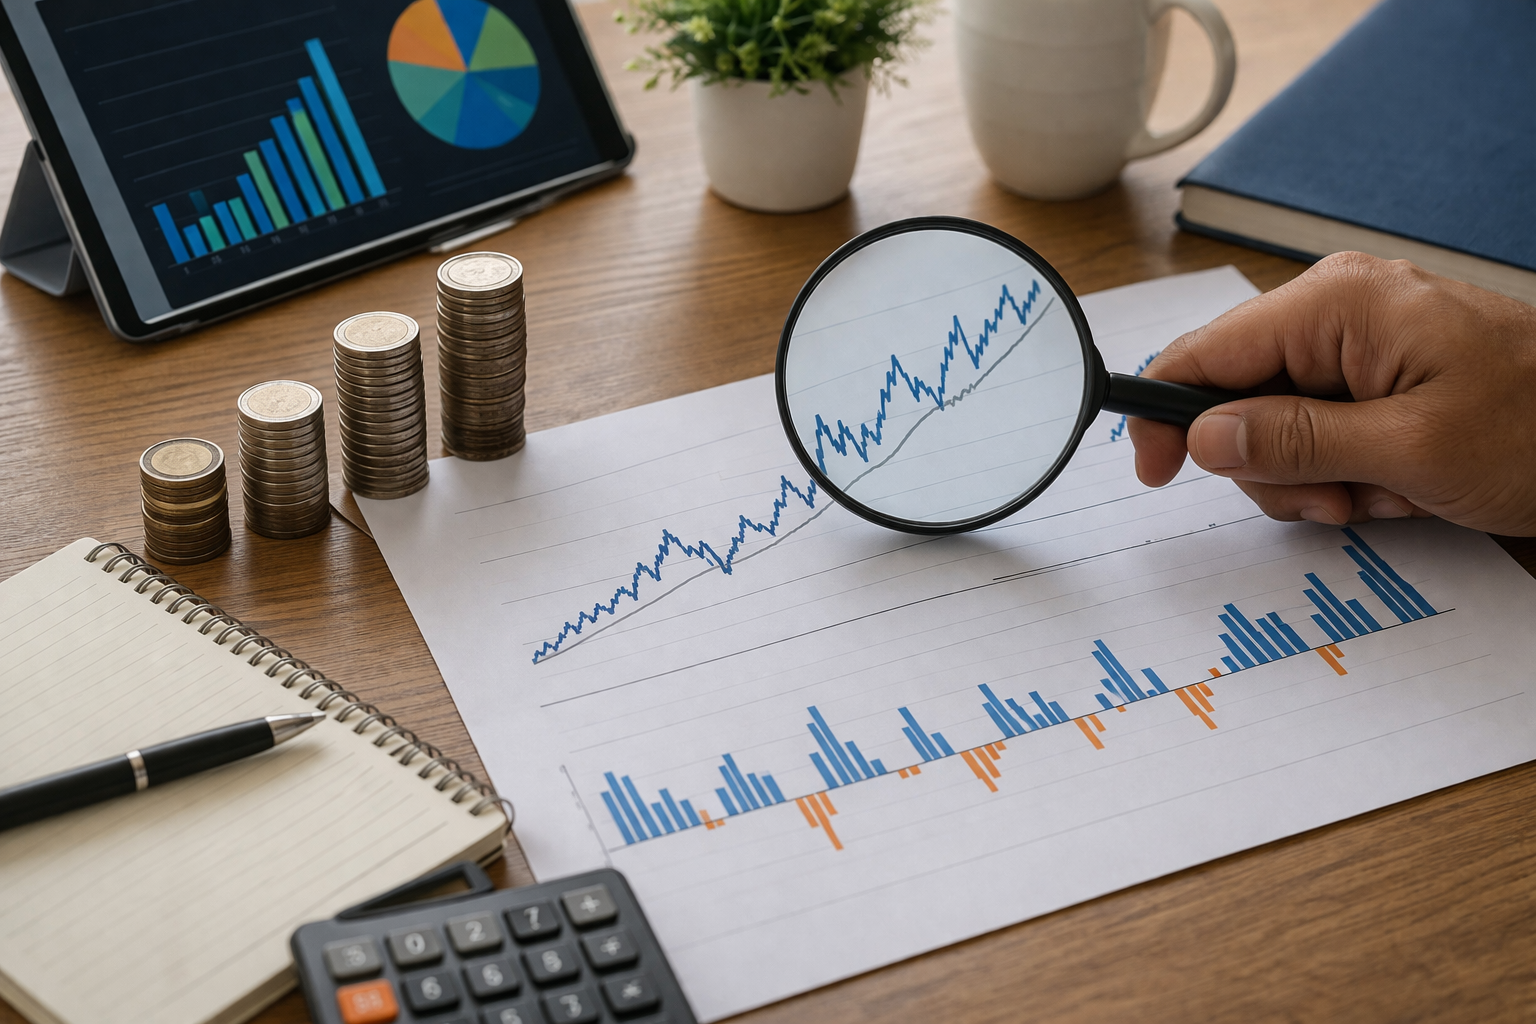
How to Interpret Mutual Fund Yearly Return Data
When you look at mutual fund yearly return figures, don't just focus on the highest number. Instead, examine the pattern across multiple years. A fund showing 25% one year and negative 10% the next is less reliable than one delivering consistent 12% to 14% annually.
Compare each year's return against the fund's benchmark index. A large cap fund should be measured against Nifty 50 or Sensex, while a mid cap fund compares to the Nifty Midcap 100. Consistently beating the benchmark indicates skilled fund management and a solid investment strategy.
Look for performance across different market conditions. How did the fund perform during the 2020 pandemic crash? What about the 2018 correction? Funds that protect capital during downturns while capturing gains during rallies demonstrate superior risk management.
Understanding Rolling Returns vs. Point-to-Point Returns
Point-to-point returns show performance between two specific dates, which can be misleading depending on when you measure. If you check returns from a market bottom to a peak, they'll look fantastic. Measuring from peak to bottom shows poor performance.
Rolling returns provide a more accurate picture by calculating returns across multiple time periods. For example, three-year rolling returns might show performance for every possible three-year period in the last decade. This method smooths out timing luck and reveals true consistency.
Analyzing Average Mutual Fund Growth Per Year
The mutual fund yearly return for a single year tells only part of the story. Calculate the Compound Annual Growth Rate (CAGR) to understand average growth over longer periods. CAGR shows what the fund would have returned if it grew at a steady rate each year.
For example, a fund might show 20%, 5%, and 18% returns over three years. The CAGR would be around 14%, giving you the average annual growth. This metric is particularly useful when comparing funds or setting long-term financial goals.
Most experts recommend evaluating at least three to five years of data. Shorter periods don't account for full market cycles, while longer periods might include outdated management strategies or different fund objectives.
Red Flags to Watch For
Beware of funds with extremely volatile yearly returns. While some volatility is normal, especially in equity funds, wild swings suggest poor risk management. A fund jumping from 30% gains to 20% losses repeatedly might be taking excessive risks.
Consistently underperforming the benchmark is another warning sign. If a fund repeatedly delivers lower returns than its index, you're essentially paying fees to receive worse performance than a simple index fund would provide.
Sudden changes in return patterns often indicate fund manager changes or strategy shifts. When you notice this, investigate further. A new manager might improve or worsen performance, and you need to understand the implications.
Finding the Best Mutual Funds to Invest

Identifying the best mutual funds to invest requires looking beyond just yearly returns. Examine the expense ratio, as high fees directly reduce your net returns. A fund with 14% gross returns but 2% expenses gives you only 12%, while a similar fund with 1% expenses delivers 13%.
Check the fund manager's tenure and track record. Experienced managers who've navigated multiple market cycles bring valuable perspective. Research their investment philosophy and ensure it aligns with your financial goals and risk tolerance.
Portfolio turnover ratio indicates how frequently the fund buys and sells securities. Extremely high turnover can generate tax liabilities and transaction costs. Moderate turnover suggests thoughtful, strategic investing rather than excessive trading.
Using Technology for Better Analysis
Modern investment platforms have revolutionized how investors access and analyze performance data. Quant Trade provides sophisticated tools that help you compare mutual fund yearly return data across hundreds of schemes simultaneously.
These platforms offer features like heat maps showing performance across categories, correlation analysis revealing how different funds interact in your portfolio, and risk metrics like standard deviation and Sharpe ratio. Such quantitative analysis removes emotional decision making and grounds your choices in data.
You can set custom filters to screen funds based on your specific criteria, such as minimum five-year returns, maximum expense ratios, or specific investment styles. This automation saves hours of manual research while ensuring you don't miss promising opportunities.
The Importance of Regular Monitoring
Checking returns before investing is crucial, but monitoring doesn't stop after you invest. Review your fund's performance quarterly or at least twice yearly. Markets evolve, strategies change, and what worked yesterday might not work tomorrow.
Compare your fund's recent yearly returns against peers and benchmarks. If underperformance persists for two to three years despite favorable market conditions, it might be time to switch. However, avoid knee-jerk reactions to short-term fluctuations.
Rebalancing your portfolio based on performance ensures your asset allocation stays aligned with your goals. If one fund significantly outperforms and now represents 40% of your portfolio when you intended 25%, rebalancing maintains your desired risk level.
Start Making Smarter Investment Decisions Today
Understanding how to check and interpret mutual fund yearly returns empowers you to build a stronger portfolio. Don't rely on tips or recent performance alone. Use comprehensive analysis, examine long-term consistency, and leverage technology to make data-driven decisions.
Ready to take your mutual fund investing to the next level? Visit Quant Trade today for powerful analytical tools, comprehensive performance data, and expert insights that help you identify top-performing funds. Whether you're a beginner or experienced investor, our platform provides the quantitative research you need to invest with confidence. Start your journey toward smarter, more profitable investing now!


Sign in to leave a comment.