In this digital-first environment, assurances of performance, reliability, and availability across systems have become critical. From a cloud-native application services platform to a hybrid enterprise architecture, monitoring becomes critical to achieving this ultimate smooth flow. Not all monitoring is the same, but these two terms are often used as synonyms- Infrastructure Monitoring and Application performance monitoring.
Observation and insight apply to both, although they depend differently on the different layers of your stack and deliver different values. Hence, understanding the difference is vital for IT teams, developers, DevOps, and even business stakeholders.
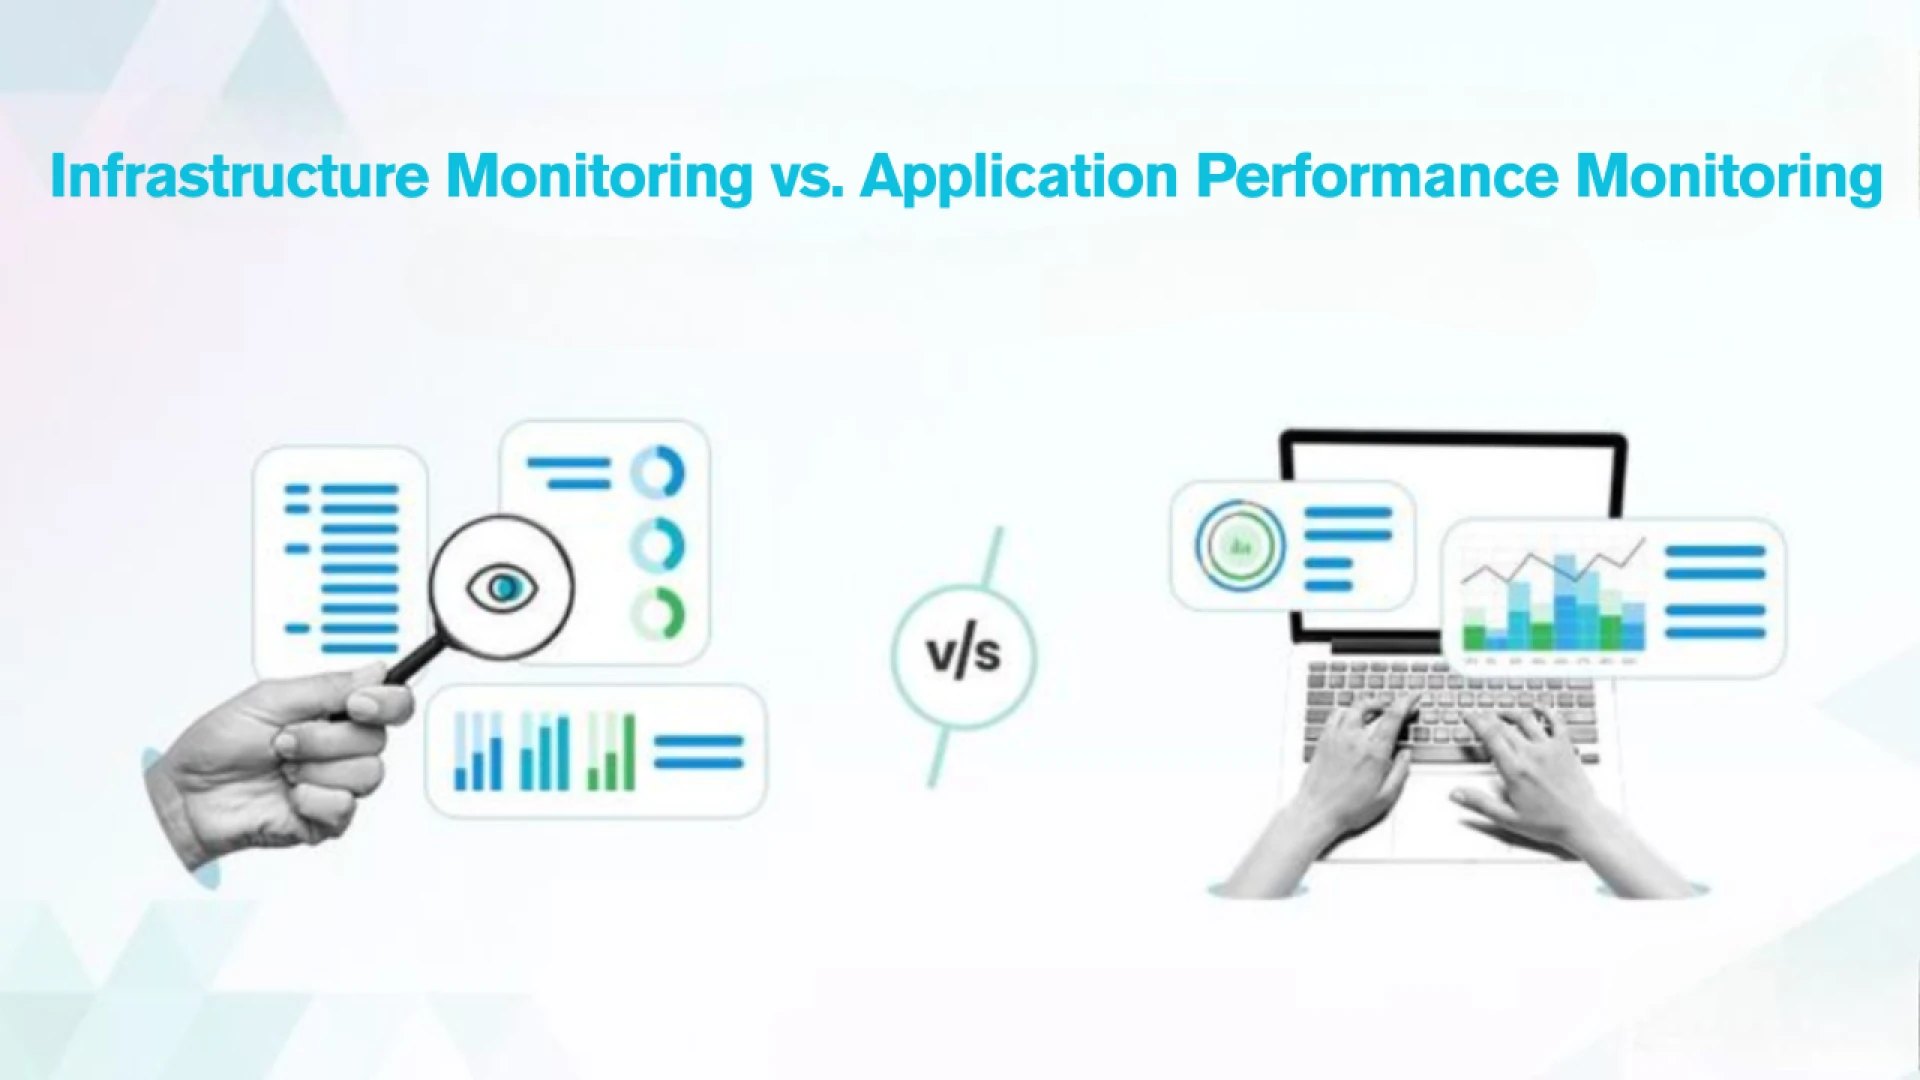
Now, let us try to survey differences in the following: Infrastructure Monitoring versus Application performance monitoring, when to use either, and how both can complement each other.
What Is Infrastructure Monitoring?
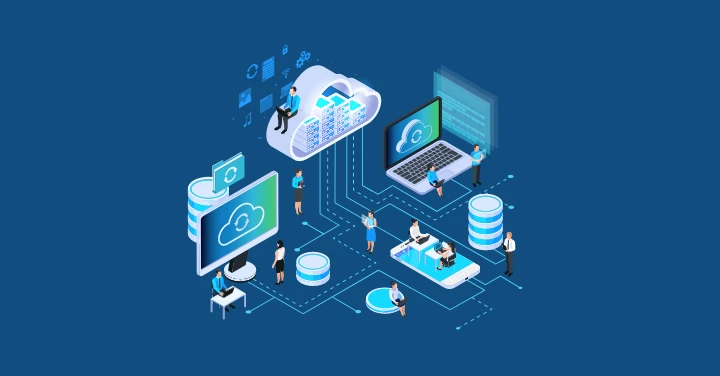
Infrastructure Monitoring involves collecting and analyzing data from your underlying IT resources - this is everything from servers (whether virtual or physical), networks and storage, databases, and even cloud infrastructure components. Infrastructure Monitoring is, therefore, the practice of making sure that everything is functioning well and efficiently.
Common metrics monitored:
- CPU and memory usage
- Disk I/O and storage capacity
- Network throughput and latency
- Server uptime and availability
- Hardware failure alerts
- System load averages
Tools commonly used:
- Nagios
- Zabbix
- Prometheus
- Datadog (Infrastructure module)
- SolarWinds
Why it matters:
Infrastructure failure leads to application failure. Monitoring this layer will help determine whether issues such as hardware bottlenecking, output from servers or most unusually, spikes in resource usage, are affecting application performance downstream.
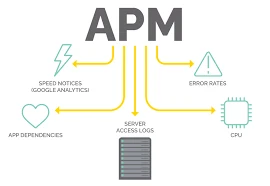
What Is Application Performance Monitoring?
Monitoring application is the word commonly used for application performance monitoring or APM. Application performance monitoring holds an interest in the health and performance of the applications themselves. This has to do with what the users are interacting with such as web applications, mobile applications, APIs, or services.
Common metrics monitored:
- Response time
- Error rates
- Transaction traces
- Request throughput
- API latency
- Application availability
Tools commonly used:
- New Relic
- AppDynamics
- Dynatrace
- Datadog (APM module)
- Elastic APM
Why it matters:
When the application runs code in an inefficient manner, it can be hurt despite the fact that the infrastructures are healthy. Memory leaks, third-party service delays, and database problems can also cause issues in the application. Application performance monitoring involving pinpointing performance abnormalities at the code level is a way of enhancing user experience while minimizing MTTR (mean time to repair).
Do You Need Both?
Definitely-improvement is the monitoring of infrastructure regarding Application performance monitoring, in that they positively complement each other and are not in competition.
Imagine your IT ecosystem is a house. Infrastructure monitoring checks that the plumbing, wiring, and foundation are all in order.
On the other hand, the Application performance monitoring ensures that the heating systems are working, that the light switches on when you flip the switch, and that the door opens from the inside.
If a user complains about slowness from your application, then infrastructure monitoring may show normal CPU and RAM usage-but only APM will show that a database query is taking 3 seconds instead of an expected 300ms. On the contrary, if your application is timing out because of an overloaded server, APM will show the symptoms, while infrastructure monitoring will provide the root cause.
Together they build a single observability stack.
How They Work Together in Real-World Scenarios
A real-world case in point:
Situation: A sluggish web application.
- Application performance monitoring signals that the web page load times doubled in the hour and errors have increased for logged-in users.
- Traces are narrowed onto a particular API endpoint as the origin of the problem.
- Check Infrastructure Monitoring, and determine that the database server beneath has run at 100% CPU because of a misconfigured Cronjob.
- Fix the job, restart the service, and page load times go back to normal.
Without both monitoring layers, you'd be playing a guessing game.
Final Thoughts
In a situation where downtime costs businesses thousands of dollars every minute, visibility is everything. An understanding of what is going wrong is as vital as knowledge of where the fault lies; hence, infrastructure and Application performance monitoring are mandatory. While evaluating monitoring tools and techniques, do not consider this to be an either/or concern. Rather, strive for the one observability solution that would unify both layers. Tools in this domain like Datadog, Dynatrace, and Elastic cover both realms with a single integrated platform, making data correlation easy, thereby enabling faster resolution of incidents.

Sign in to leave a comment.