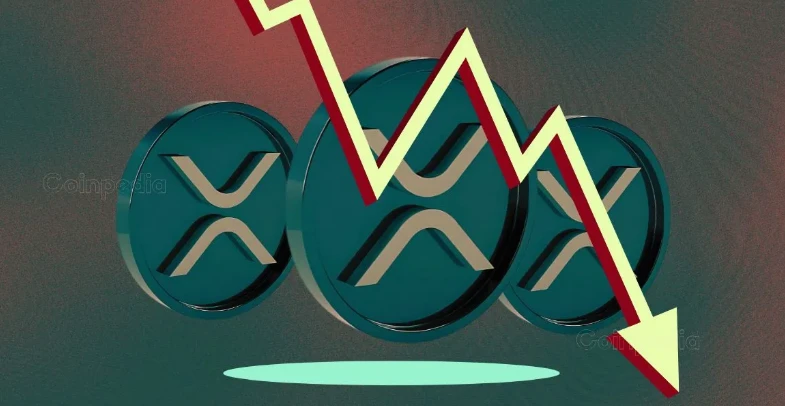
XRP has started a fresh recovery wave, bouncing back from the $2.20 support zone. The cryptocurrency is currently rising and might clear the key $2.550 resistance level.|
XRP Price Movement and Support Levels
XRP began a strong upward move after testing the $2.20 support zone. The price is now trading above $2.40 and the 100-hourly Simple Moving Average, signaling an improving market sentiment. Additionally, a bullish trend line has formed with support at $2.480 on the hourly chart of the XRP/USD pair.
Resistance Levels to Watch
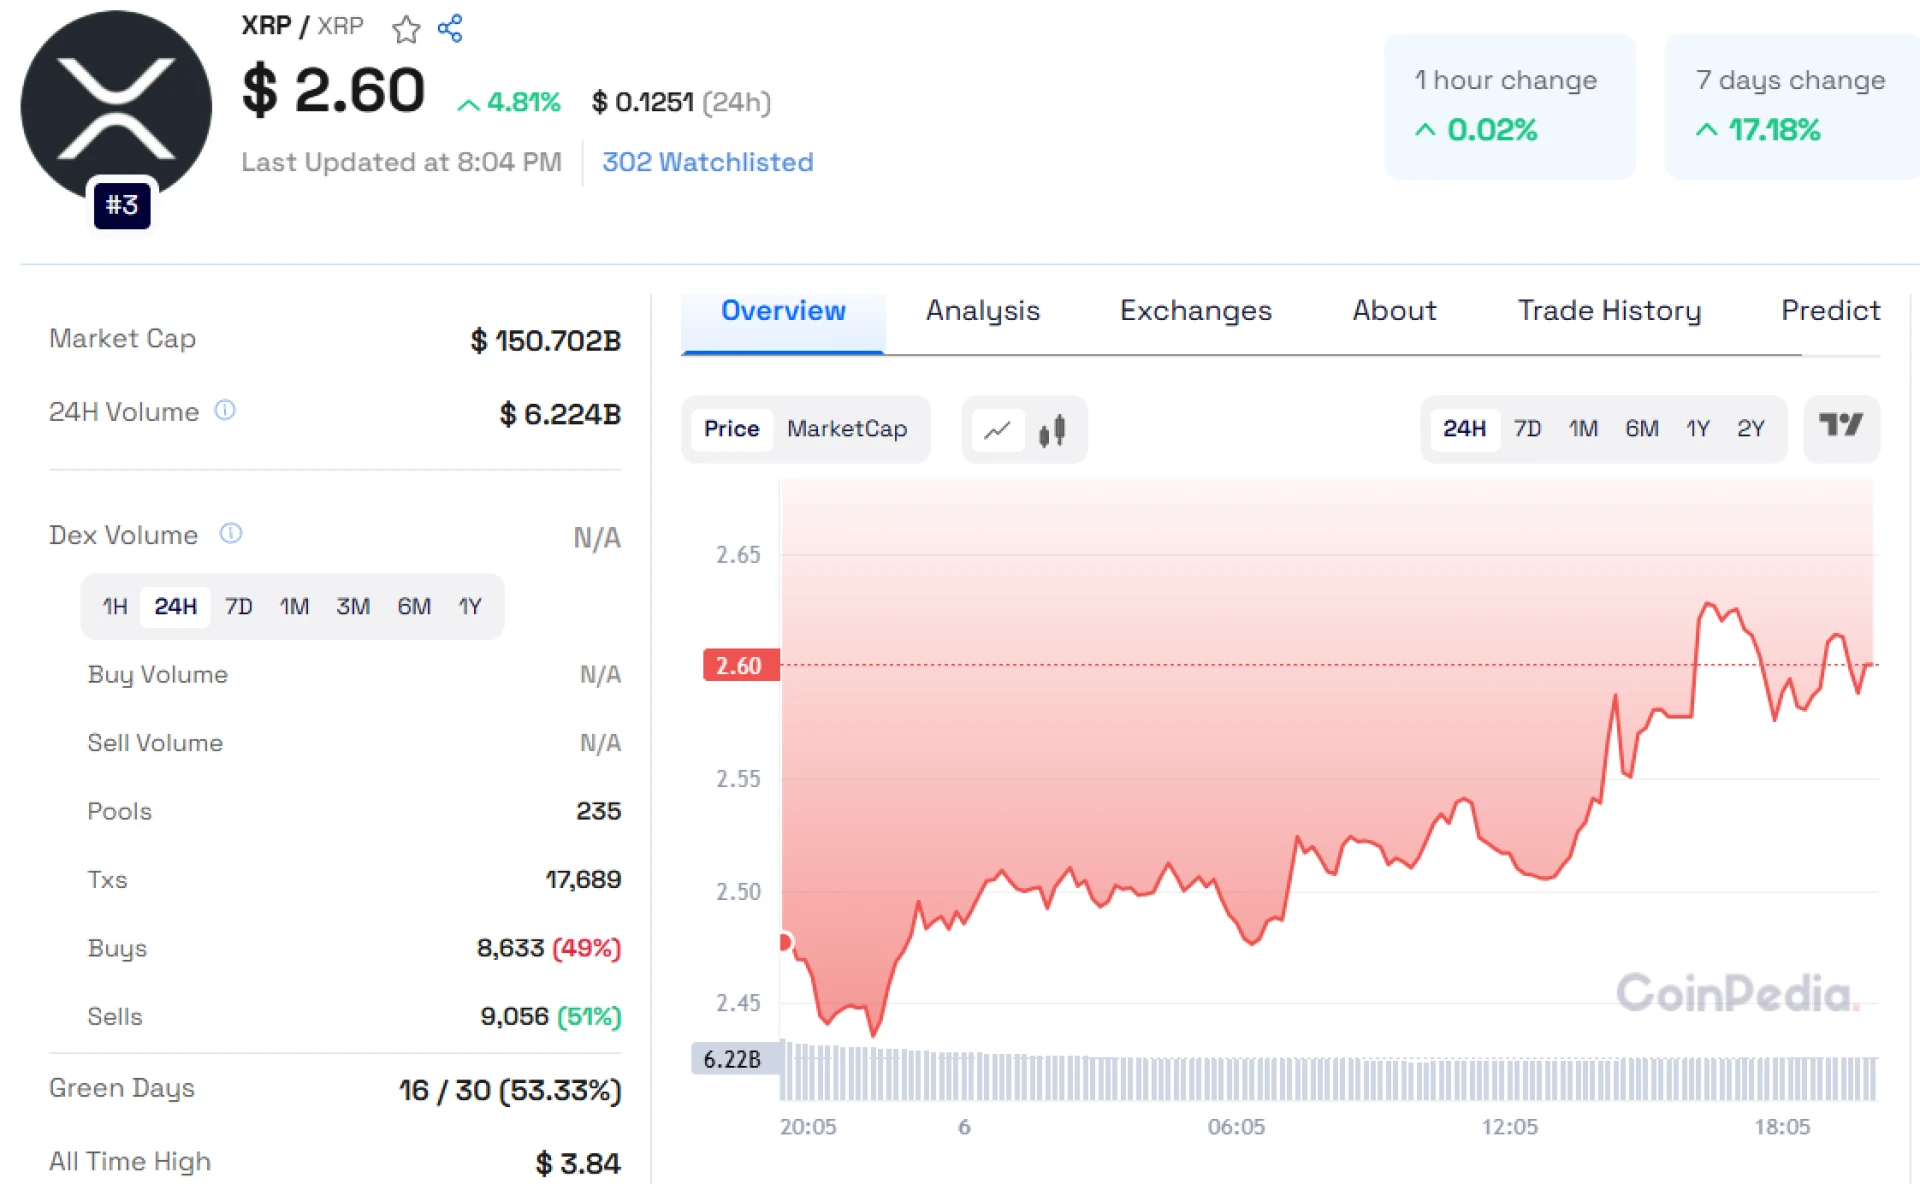 XRP is facing resistance around the $2.550 level. Currently trading at 2.60 as per Coinpedia market data .A move above this level could push the price toward the next major resistance at $2.60, followed by $2.70. This price range aligns with the 61.8% Fib retracement level of the downward move from the $3.00 swing high to the $2.211 low. If XRP Price breaks above $2.70, it could continue to rise toward $2.80 and possibly $2.880 in the short term. The $3.00 level is seen as the next major hurdle for the bulls.
Potential for a Decline
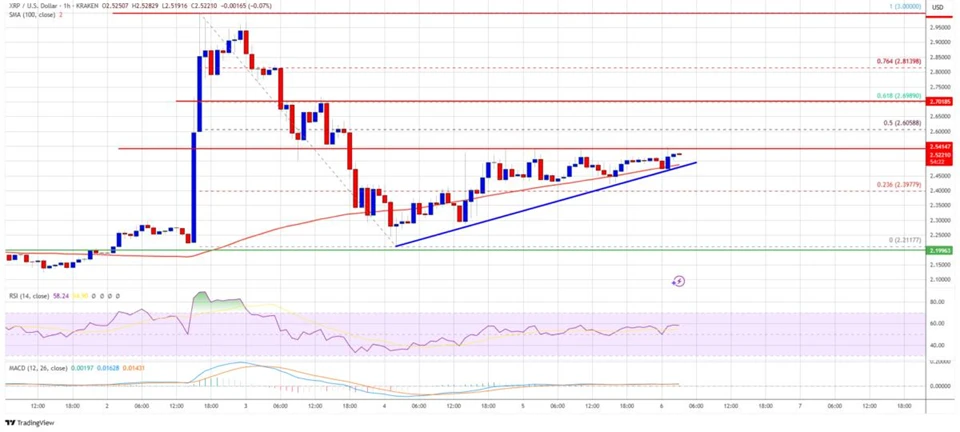
However, if XRP fails to break the $2.550 resistance, the price could face another decline. The initial support lies near $2.480, followed by $2.40. A close below $2.40 could signal further downside, with support levels at $2.320 and $2.20.
Technical Indicators
- Hourly MACD: The MACD for XRP/USD is in the bullish zone, gaining momentum.
- Hourly RSI: The RSI for XRP/USD is above the 50 level, indicating a positive short-term outlook.
Key Support and Resistance Levels
- Support Levels: $2.40, $2.320, and $2.20
- Resistance Levels: $2.550, $2.60, and $2.70
XRP is on a recovery path, but it faces critical resistance at $2.550. If it clears this, we could see further gains toward $2.70 and beyond. However, failure to break through may result in another decline, with support zones at $2.40 and $2.320 being crucial for price stability.


Sign in to leave a comment.